5 Session 4: Relational Event Model
5.1 내용정리
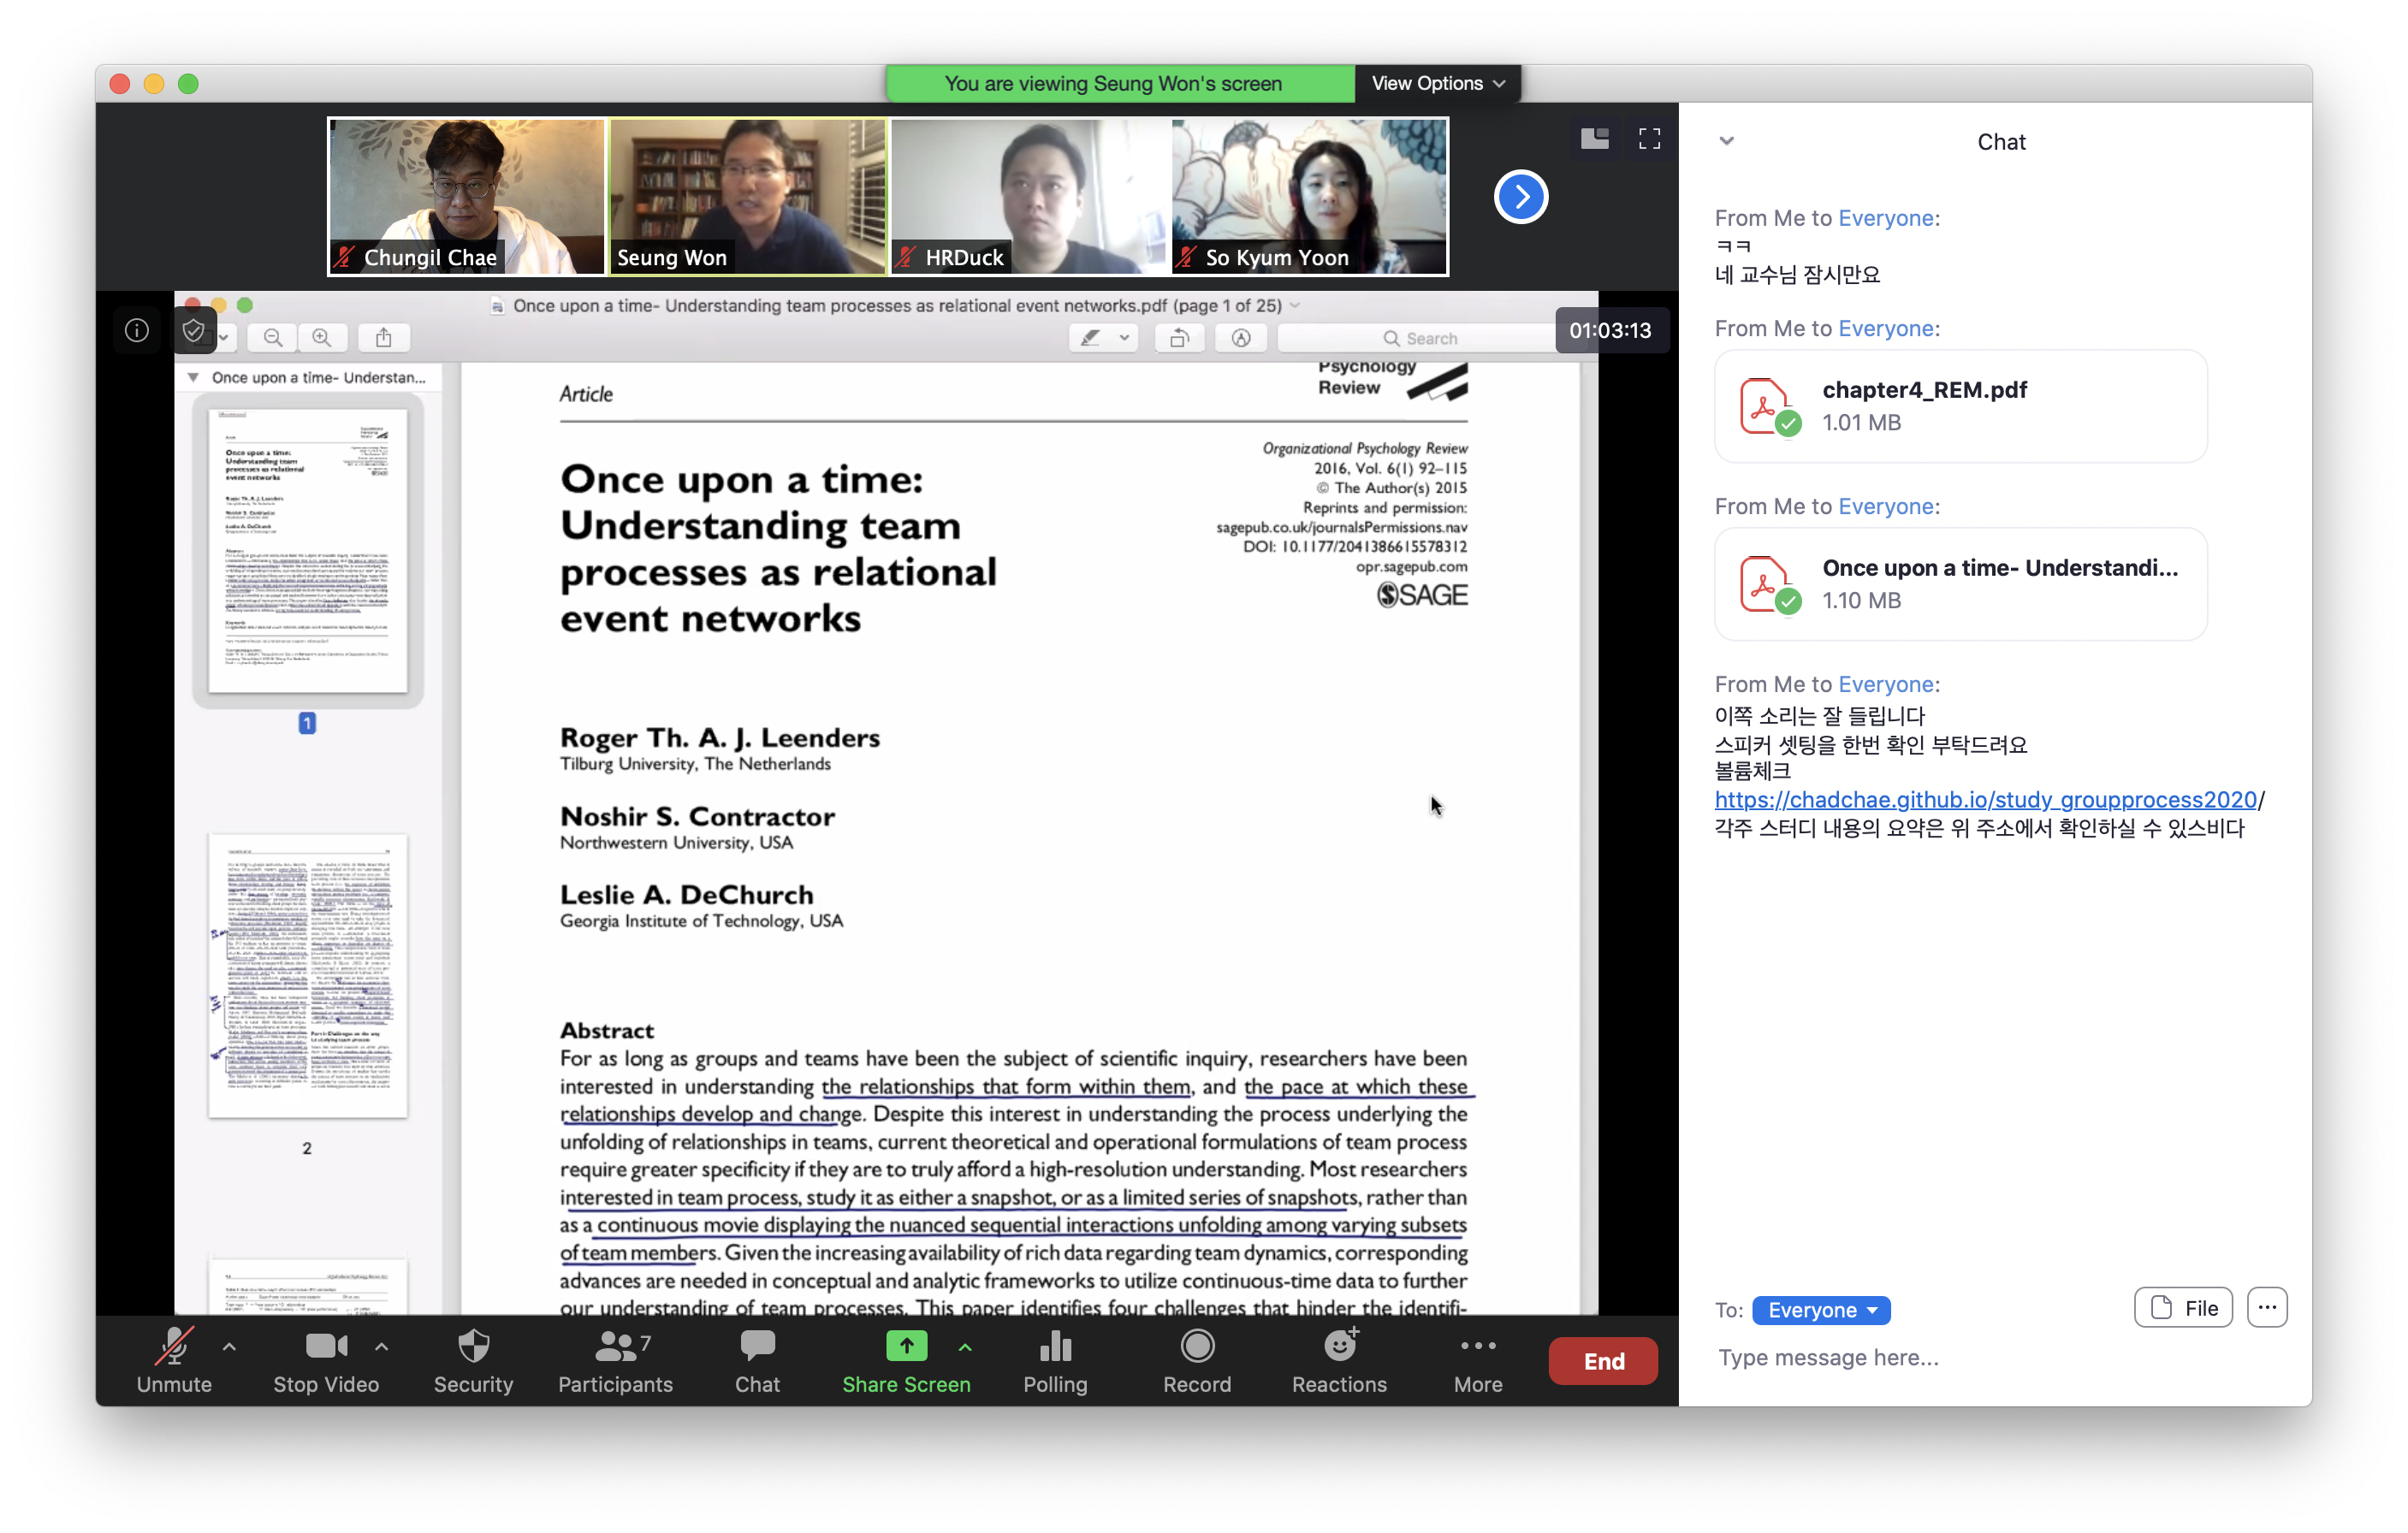
Article 1: Once upon a time: Understanding team processes as relational event networks
- What are the most 2~3 valuable take away from REM?
- Which aspect of the article and method was most difficult or challenging?
REM is fundamentally a combination of quantitative research on teams and social network analysis (SNA).
P. 92 – Part 1. Needs to know the past. Theoretical frameworks for teams: Open system, Complex Adaptive System. Types of tasks, members, interaction, and time as critical building blocks
Gap between the conceptualization of teams (Ind-Team-Org) and team dynamics and phenomena (e.g., local members’ initiation)
P. 93 – Tuckman’s model. IPO framework (Hackman). Various frameworks for understanding team process (interaction model, group development model, decision making model). And compositional views (integrative literature by Levine & Moreland).
P. 94 – Table 1 shows what has been measured for DV and IV, and effect size (.2~.4)
Pp. 94~97, 4 Challenges: Common (design, operations, and measurement issues)
- Homogeneity (my dissertation, only 2% was negative behavior, committed by small #), norming behaviors or new process appear at different times.
- P. 95. Heterogeneity by teams and members (performance/effectiveness differ by teams)
- P. 96. Repeated measures or panel data still fall short.
- P. 96. Time – most difficult variable to study. And many more (e.g., power, diversity, SKA, affects)
P. 97: Part II. Solutions – Methods that can see & analyze process
P. 98 – Table 2: Time, sender & receiver, event contents (know any framework?), sentiment, modality. This is data format and type to apply REM. Assumptions about modeling – rate/% that is likely to happen given conditions of preceding attributes or events. Modeling what’s going on.
P. 98~p. 99: SSS (Sequential Structural Signatures) – Not predefined, but emergent. Q: Log Linear Function – Why? Why not linear modeling? What does the formula (p. 99) tell you? (Rate increase reflects interaction increases).
P. 100 - SSS signatures. Which properties do you see in team dynamics/group work? Reciprocity, transitivity, participation turns, multiplexity, homophily, high indicator, popularity, inter-team inertia, reciprocity, and mimicry (and more). Selecting which ones are most difficult & important (which ones?). Some are more process focused - Gibson’s framework (13 turn types, turn taking, stealing, claiming, usurping, etc).
P. 103 – In modeling, should incorporate exogenous attributes and relations too (e.g., multiplexity)
P. 104 – Multiple SSSs and Memory – SSS can be others, such as info sharing, or team leadership structure. For Memory, can incorporate recency or decay (e.g., half life on p. 105 function, or memory decay. (e.g., Davenport, KW typology)
P. 105 – Outcome specification. SSS can be compared among teams. Related approaches: Bales’ 12 interaction framework, context free frame (amount of talking, vocalization, etc.), change agent and support or resistance, and more), ML of 12 work team patters in org teams (p. 107, more exploratory approach), and Markov model
Which ones do you think are important?** Some are inter-team level, why? SSS are more explanatory and inferential.
- P. 107 –** statistical model – minimal. Sender, receiver, time. Hazard function. (e.g., if previous conflict, can add to the model)
- P. 108 –** Empirical example. MTS, 4 member convoy moving simulation among 2 dyad teams (simulation). Hypothesis: 1) role of inertia and reciprocity, and 2) negativity of interteam reciprocity and mimicry.
- P. 109 – Table 4. Results show first 2, positive, all positive at two times imply group norms. Here, determining timing of events will be key.
Chapter 4. REM to Model Behavioral Dynamics by Butts & Marcum
- Using empirical data, shows how ordinal vs. continuous data can be analyzed
- P. 51 – Network evolves.
- P. 52 – Social selection vs. influence. Relational event is social instances of social behaviors (communication, transfer, hostility), combination of SNA and agent based modeling. Until pp. 54, presents background info. Differences between ERGM and SIENNA (systems of simultaneous relationships)
- Pp. 54~58. How it works. Basic building block: s,r,c,t (sender, receiver, action, time). In modeling, concepts such as Cartesian product, hazard function (propensity analysis). Look for formula 4.1. Left is estimate, right is through values happening (at time, given history, u is vector of functions (a priori), prior events conditioned, etc. Theta is mechanisms generated (emergent from data). Figure on p. 56. Can you make sense of GOF tests, actor-level fixed effects, subsequence effects, time invariant and time varying covariate effects? Decisions driven by RQ and empirical validation. Important assumptions: (1) all events are recorded and onset is exogenous, (2) no events are simultaneous, (3) and event hazard and support are piecewise constant, only change by endogenous or clock exogenous time.
- P. 58 Uses relevant package. Samples
- P. 59 – data formatting as edge list. Optional: time varying SR covariate (mpn (actor)), time invariant SR covariate (n x p), time invariant event covariate (pnn), time varying event covariate (mpnn). WTC data, n=37, 482.
- P. 60 – McFarland class. 18 stu and 2 T. Act cov 2 (gender and teacher), t=691
- P. 61~62 – REM Code syntax. Various arguments including data format, n, effects, ordinal, and when sending cov, as Rlist (indegree, , outdegree, total degree, recency, fraction of receiving, shared partners (for transitivity), turn/shift effects, etc.
- P. 63. R Demo (head function) – shows order, sender and receiver (here, exploring data, and checking accuracy)
- P. 64 – gplot. Examine patterns.
- P. 65 – Model 1. Simple covariate model (=role similarity/diff), testing model fit using summary(). CovInt effect as cumulative
- P. 66 Model 2, role similarity for sender and receiver differently. Model improvement was small (BIC).
- P. 67~68. Model 3 – Endogenous social dynamic effect: Participation shift reciprocity (PSAB-BA). Result: 1500 times more likely
- P. 69. Model 4 – Adding turn receiving (PSAB-BY) and turn continuing (PSAB-AY)
- P. 70. Model 5 – Adding recency (RRecSnd)(RSndSnd) – reduced effect of reciprocity, all significant.
- P. 71~72. Model 6 - Following up graph summary, testing preferential attachment (by normalized Total degree to receiving calls, NTDegRec). Can continue, but by overall improvement than null, can move onto assessing model adequacy
- P. 73. Assessing model accuracy. There are many, here, (2) predicting next event and (1) evaluating an error. Null residual < 2log(3736) = about 14. Fraction below null (88%), fraction less than residuals 3 (random small value), mean of null resid (11%)
- P. 74 – Prediction. (3) To get 50% right, needs about 1.73 case. (4) Another confirmation by visual inspection (show several cases using head (),
- P. 75 – (5) can see surprise cases of third party exceptions (indicating preferential attachment)
- P. 76 – (6) empirical cumulation percentage to get it right (.05, .01, .025) using ecdf
- P. 77. (7) most strict measure – model testing (either 79%, both (68%), and for each sender and receiver, 72 vs. 75% respectively) *Important take away? Challenges or insights?*
- Exact Time Histories
- P. 78. Edge list shows time info.
- P. 79. Starting modeling with covariates. Model 1. Timed data can estimate pacing constant (simple Intercept by setting vector of 1s for actor sending effect). This is the same as null model (res are the same for both = exponential waiting time model calibrated to the found comm rate). (n * n-1 * Intercept cof = # of events in minutes) < can check with observed data.
- P. 80 – Model 2. Structural heterogeneity (for Fig 4.6), teacher and gender (intercept only for sender). Can tell the effect of gender is not significant.
- P. 81 – Without gender, but overall improvement is marginal (by BIC score diff)
- P. 82. Modeling class conversations. Recency plus turn-taking, sequential address, and turn usurping. Model 3: Inertia and Recency. Model 4: Turn continuing, turn receiving.
- P. 83~84 – Where Model 6 stops. Interpretation of a Fitted Model. Interpreting model coeffcients log inverse gives a probability chance. However, high face value needs caution (non-chance happening is much more frequent – based on per minute # of events)
- P. 85. Another is to examine wait time for an actor to respond given an immediate event (i.e., # of particular events and their propensity for diff conditions (c.f., can compare response time by roles)
- P. 86. Assessing Model Adequacy. Plotting histogram, then studying % of exact, either, and sender vs. receiver (can see much lower than radio communication)
- P. 87. At .05, .1, and .25 (at 89%), much lower than WTC data.
- P. 89. Examining model surprise. Without null residual, seeing what is not in 5% (eventlist observed rank bottom 5%), graph showing sub-group interaction.
- P. 90 – Expansion: Hierarchical REM, latent interaction roles, etc.
5.2 더 읽어볼 자료
- Butts, C. T. (2008). 4. A Relational Event Framework for Social Action. Sociological Methodology, 38(1), 155-200.(Butts 2008)
- Leenders, R. T. A., Contractor, N. S., & DeChurch, L. A. (2016). Once upon a time: Understanding team processes as relational event networks. Organizational Psychology Review, 6(1), 92-115.(Leenders, Contractor, and DeChurch 2016)
- Vu, D., Pattison, P., & Robins, G. (2015). Relational event models for social learning in MOOCs. Social Networks, 43, 121-135.(Vu, Pattison, and Robins 2015)
- Pilny, A., Schecter, A., Poole, M. S., & Contractor, N. (2016). An illustration of the relational event model to analyze group interaction processes. Group Dynamics: Theory, Research, and Practice, 20(3), 181.(Pilny et al. 2016)
- Wellman, N. (2017). Authority or community? A relational models theory of group-level leadership mergence. Academy of Management Review, 42(4), 596-617.(Wellman 2017)
- Quintane, E., & Carnabuci, G. (2016). How do brokers broker? Tertius gaudens, tertius iungens, and the temporality of structural holes. Organization Science, 27(6), 1343-1360.(Quintane and Carnabuci 2016)
- Liang, H. (2014). The organizational principles of online political discussion: A relational event stream model for analysis of web forum deliberation. Human Communication Research, 40(4), 483-507.(Liang 2014)


