9 Session 8: Simulation
9.1 내용정리
Simulation, in conjunction with virtual experimentation, is a useful tool for the organizational researcher because it facilitates comparative analyses of complex, multilevel team processes.
Results may be leveraged to inform theory building and guide the efficient design of future field or laboratory research, particularly when large resource expenditures may be required.
Simulation and team research
- collective learning (Anderson & Lewis, 2013)
- interaction modes (Bhuiyan, Gerwin, & Thomson, 2004)
- cognition (Grand, Braun, Kuljanin, Kozlowski, & Chao, 2016)
- communication patterns (Kennedy & McComb, 2014)
- Project complexity (Kennedy et al., 2011)
- communication frequency (Patrashkova & McComb, 2004)
- transactive memory (Ren, Carley, & Argote, 2006)
- Team member replacement (Solow, Vairaktarakis, Piderit, & Tsai, 2002)
Dilemmas “All research designs pose dilemmas for the researcher in that tradeoffs must be made between generalizability to populations of interest, precision in the measurement and control of variables, and realism related to the context in which the behaviors would be observed”
- generalizability
- precision
- realism
Simulation provides a solution that attempts to address generalizability and realism, at the expense of precision.
Researchers must decide what type of simulation procedures they want to develop and validate
- Ex) team domain developed simulation procedures via mathematical interpretations of theoretical relationships
- Or others grounded their procedures with empirical data
As with all research, determining the best path forward must be based on criteria such as
- the research questions of interest
- access to data
- availability of adequate theory to model
Ensuring that the simulation procedures, when executed, provide results that depict a reasonable representation of reality is of primary importance
Examples: infoming theory about team communication and can be tested through laboratory or field experimentation
Team-level, continuous, cross-sectional data
- how project complexity impacts the curvilinear relationship between team communicaiton and performance identified in Patrashkova-Vozdolska, McComb, Green, and Compton (2003)
transcribed and coded communication strings (discrete, longitudinal data) from laboratory
- relationship between team performance and when team shift their conversations among different process
Basic Overview of simulation and virtual experimentation
two methods: simulation and virtual experimentation
Simulation requires computer code and random numbers
- the computer code imitates processes in the real world
- the random numbers represent the variability inherent in those processes
Vitual experiments
- Researchers use closed system (computer code in virtual experiments or laboratory apparatus in laboratory experiments)
- Multipulate parameters within those systems to study how the parameters influence outcomes
- In virtual experimentation, the experiment is conducted using simulation
- The computer code is executed multiple times to conduct one simulation run for each manipulation designed into the experiment.
- One benefit of virtual experimentation is that each manipulation can be run hundreds of thousands of times in a matter of minutes
- Sample sizes this large in a laboratory would probably be cost prohibitive and require significantly more time
Step-by-step instruction for conducting simulation and virutal experimentation research
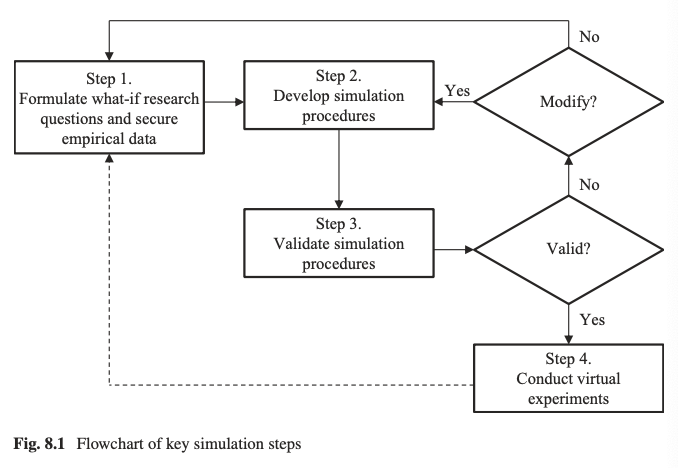
Screen Shot 2020-07-18 at 10.00.00 AM
Step 1. Formulate what-if research questions and secure empirical data
Purpose: Establish coherence among your research questions, variables, and available data
- what-if teams use communication modalities with more or less synchronicity; does the cohesion-effectiveness rela- tionship change?
Actions: Determine research questions regarding process of interest, identify corresponding variables, and secure empirical data
- The variables of interest are cohesion, effectiveness, and modality
Outputs: Study goals, process parameters, and empirical data
- Empirical data from the employee survey is available and can be partitioned by communication modality
Step 2. Develop simulation procedures
Purpose: Articulate relationships among variables and the processes connecting them, ensure adequate power for generalizability, and convert simula- tion steps into actionable computer code
Actions: Identify simulation steps, establish stopping criteria, and code simulation procedures
Outputs: Logical depiction of the real-world process of interest, sample size requirements, and actionable computer code.
Step 2A. Identify simulation steps.
- The procedures you create should reflect your decisions about what variables need to appear in your simulated datasets to test your what-if research questions
Step 2B. Code your simulation
- Based on the flowchart you (or a valued collabora- tor familiar with computer coding) can code your simulation in a computer program that will provide efficient and reliable results.
- Coding the simulation procedures for the continuous data basic example.
- Coding the simulation procedures for the discrete data basic example.
Step 3. Validate simulation procedures
Purpse: Compare simulation results with real-world data to ensure that the results reasonably represent reality
Actions: Test results from executing the computer code
Output: Valid, actionable computer code
Validation of your simulation procedures helps you ensure that your results are representative of the real world
To conduct meaningful validation, you must decide which parameters need to reflect the real world and how you will test them.
These parameters will be compared to the empirical data using common statistical comparison tests (e.g., χ2, t-test) or other non-parametric tests (e.g., Wilcoxon rank sum test, Mann-Whitney test).
If your testing does not support the validation, then you will want to stop and evaluate why the validation was not successful. We suggest that you have two options:
fix your simulation procedures or
go back to the beginning and reformulate your what-if research question and/or secure more (or different) empirical data. Common problems come from issues with the initial assumptions (e.g., normality, conditional relationships, linear relationships), miscalculations using the empirical data, or coding errors.
Step 4. Conduct virtual experiments
Purpose: Compare simulation results across varying conditions to inform theory construction and future research activities
Actions: Manipulate simulation inputs to ascertain how results change under varying conditions
Outputs: Results that answer the original what-if research questions and provide insights into future theory and research development
- Once you have validated your simulation procedures you can conduct virtual experimentation. Specifically, you can now generate datasets with manipulated conditions by changing parameters in your simulation procedures. The way the parameters are changed should be based on your theoretical understanding of the phenomena and your what-if research questions.
- Finally, a compari- son among scenarios and the empirical data indicate that significant differences exist, at least between the second scenario and other datasets.
Example Applications
In Kennedy et al. (2011), we simulate continuous data using an empirical dataset that was generated from employee questionnaires. We study the curvilinear relationship between team communication and performance under vari- ous levels of project complexity.
Step 1: Formulate what-if research questions and secure empirical data. The impetus for this study came by combining the ideas and results from two studies con- ducted using cross-sectional survey data.
Patrashkova-Vozdolska et al. (2003) found a curvilinear relationship between team communication and perfor- mance that was different depending on the media used by the team to communicate.
McComb, Green, and Compton (2007) characterized project complex- ity as having two dimensions (i.e., multiplicity (having multiple options for accom- plishing the project and/or possible end states to satisfy) and ambiguity (i.e., conflict and/or uncertainty associated with options and end states)) and found that project complexity moderated the relationship between team flexibility and performance.
We were then interested in delving further into the team communication-performance relationship and wondered how project complexity might impact it. We did not, how- ever, have an adequate sample to test this relationship using the empirical data avail- able. We decided to develop simulation procedures and conduct virtual experiments to test the what-if research question: what if project complexity levels were different, how might the communication-performance relationship be affected?
To test this what-if research question, we decided to simulate team-level data about how frequently various communication media are used under different levels of project complexity.
Method: This data could then be used to replicate the multivariate regression analysis from Patrashkova-Volzdolska et al. (2003), where team perfor- mance was regressed on four control variables, three linear terms representing com- munication media (i.e., email, telephone, and face-to-face), and a squared term for each communication media. Regression analysis was conducted for each level of project complexity.
The empirical dataset available was from a field study and contained team-level data from 60 cross-functional teams.
Mean vectors were computed for the performance, communication, and control variables. These vectors were then used to compute partitioned covariance matrices, where performance variables were treated as multivariate normal conditional on the media and control variables.
Step 2: Develop simulation procedures. We applied the Monte Carlo method for multivariate normal sampling using mean (μ) and covariance (Σ). Our sample size was 10,000 simulation runs of 100 simulated teams each.
Step 3: Validate simulation procedures. To validate our simulation procedures, we computed the mean vector and partitioned covariance matrix using the entire empirical dataset (i.e., no partitions for project complexity).
- We executed 10,000 simulation runs containing 100 simulated teams each. In other words, we simulated 10,000 samples with n=100 teams in each sample. For each sample, we estimated regression parame- ters and averaged each regression estimate, p-value, and R2 across the 10,000 samples.
- The results of the simulated data patterned the empirical data. For example, when efficacy was the performance variable, both email and email2 were significant and the direction of the coefficients were the same (positive for email and negative for email2)
Conduct virtual experiments. To answer our what-if research question about the impact of project complexity on the communication-performance relationship, the empirical dataset was partitioned based on the project complexity reported by the teams.
- Median values of multiplicity and ambiguity were used to determine if a team in the empirical dataset was completing a project of high or low complexity. Eight experimental conditions were examined: high multiplicity-high ambiguity, high multiplicity-low ambiguity, low multiplicity-high ambiguity, low multiplicity-low ambiguity, high multiplicity only, low multiplicity only, high ambi- guity only, and low ambiguity only.
- For each condition, 10,000 samples of 100 teams each were generated and the regression results were computed using the same approach as we used for validation.
The results suggest that in many cases the same inverted curvilinear relationship between communication and performance can be expected. In some cases, however, more communication may be better. For example, teams may be more efficient if they communicate face-to-face when ambiguity is very low or very high.
In Kennedy and McComb (2014), we simulate discrete data in the form of communication strings using an empirical dataset that was generated by coding transcribed team communication from observed laboratory teams. The process shift indicates “the point in time when teams complete their focus on a process and change to focus on one or more different processes” (Kennedy & McComb, 2014, p. 784).
Step 1: Formulate what-if research questions and secure empirical data. In this example, we had a what-if research question that led us to generate an empirical dataset. While conducting laboratory simulations where teams of three undergraduate students completed a scheduling task, we began discussing how processes unfold over time
- Pulling all of this evidence together, we decided to pose the what-if research question: what if interventions affected team communication about processes, would it change (i.e., help/hinder) the relationship between when process shifts occur and team performance?
Step 2: Develop simulation procedures. Our initial investigation of the empirical data suggested that topics were discussed in different proportions across quartiles of communication.
To ensure we were able to generate realistic communication strings, we calculated several distributions representing a variety of characteristics of the communication strings, including communication string length, topics per quartile, and the number of observations per topic per quartile.
The simulation procedures included eight steps:
select the length of these communication string;
divide the string length so that the program can trace quartile completion and change to the appropriate distributions as the communication string progresses through quartiles;
go to the first observation point of the communication string;
call up the distributions about topic;
select the topic to be inserted into the communication string;
select the number of observations to be assigned to the topic;
insert the selected topic for the selected number of observations; and
update the posi- tion point in the communication string and check whether the quartile length and/or string length has been reached.
Step 3: Validate simulation procedures. To validate the procedures, we executed our simulation procedures to generate communication strings for 10,000 simulated teams.
We then evaluated the simulated communication strings on six characteristics:
communication string length,
topics selected per quartile,
number of observations of a topic per quartile,
the frequency of transitions from one topic to the next topic selected by quartile,
when teams first shifted topics, and
the performance associated with communication strings.
The final evaluation required generating performance scores for each simulated communication string using the points where process shifts occurred.
Step 4: Conduct virtual experiments. To answer our what-if research question about the impact of process shifts on team performance, we manipulated commu- nication by changing the probabilities depicting when a topic might be discussed.
- we tested eight different experimental conditions that are grounded in our theoretical understanding of what communication patterns may enhance team performance: (1) initialize mission analysis by coding it as the first message exchanged by teams, (2) initialize strategy formulation, (3) delay action processes by one quartile by setting the probability of exchanging an action message during the first quartile to 0; (4) delay action processes by two quartiles; (5, 6, 7, & 8) initialize mission analysis or strategy formulation and delay action by one or two quartiles.
The results suggest that delaying action until after the midpoint of the team’s life cycle may be the most effective intervention.
When valid simulation procedures are used to conduct virtual experiments, the results have the potential to help researchers construct theory and design future empirical work
9.2 더 읽어볼 자료
- Knowledge sharing in an organization (Yang and Wu 2008)
- An investigation of project complexity’s influence on team communication using Monte Carlo simulation (Kennedy, McComb, and Vozdolska 2011)
- When Teams Shift Among Processes: Insights From Simulation and Optimization (Kennedy and McComb 2014)
- AR/VR Past, Present, Your Organization’s Future (https://towardsdatascience.com/augmented-reality-ar-trends-the-past-present-future-predictions-for-2019-8e1148345304)